LFX Mentorship with CNCF Jaeger - Final Month Progress Report for Charts Migration Project
Here's the progress report of the third and final month contributing to CNCF's Jaeger's Chart Migration Project as part of the LFX Mentorship

Mobile & Web Developer | Flutter | MERN | Next.js | T3 Stack
MLH Web3 Fellow'23 | LFX Mentee @ CNCF Jaeger'23 | Google Code-in 2019 | Open-source is <3
Web3 and Blockchain 🚀
Introduction
This blog post is regarding my experience during the third and final month of this program, the report for the first and second months has already been published.
I'm assuming you're new here and don't have much idea regarding LFX and the Jaeger project, in case not, you can directly jump to the progress report.
What's LFX Mentorship?
LFX Mentorship is an open-source program designed to foster the growth of next-generation open-source developers. The Linux Foundation runs the program, it pairs talented individuals with experienced mentors within various open-source projects like CNCF, Hyperledger, etc., enabling mentees to gain hands-on experience, contribute to impactful projects, and develop valuable skills
What's Jaeger?
Jaeger is an open-source distributed tracing application used to monitor and troubleshoot complex software based on microservices architecture.
Jaeger was originally developed at Uber but was later donated to the Cloud Native Computing Foundation (CNCF) for maintenance and further development.
Project Overview
The Jaeger project has a lot of different graphs and visualization views, over the time different libraries were added to support different graph views, which led to having multiple graphing libraries as project dependencies, which is undesirable as it makes things like maintenance, debugging, refactoring, etc very difficult.
The goal of this project is to replace all libraries with a single library that can support all existing views, this will lead to more uniform and consistent designs along with reduced bundle size, faster performance, fewer configurations, and easy to maintain codebase.
More details about this project can be viewed here.
Project Progress
Let's continue from where we left off in the last blog.
Week 9
This week started with my mentor Yash Sharma meeting to discuss changes, I showed him what I achieved with DirectedGraph and he was happy with the changes and asked me to send those changes over so he could review the code.
I then organised the code better and created separate pages for new graphs, so that Yash and Yuri (the project maintainer) could view and compare the changes, I submitted the code as a draft pull request.
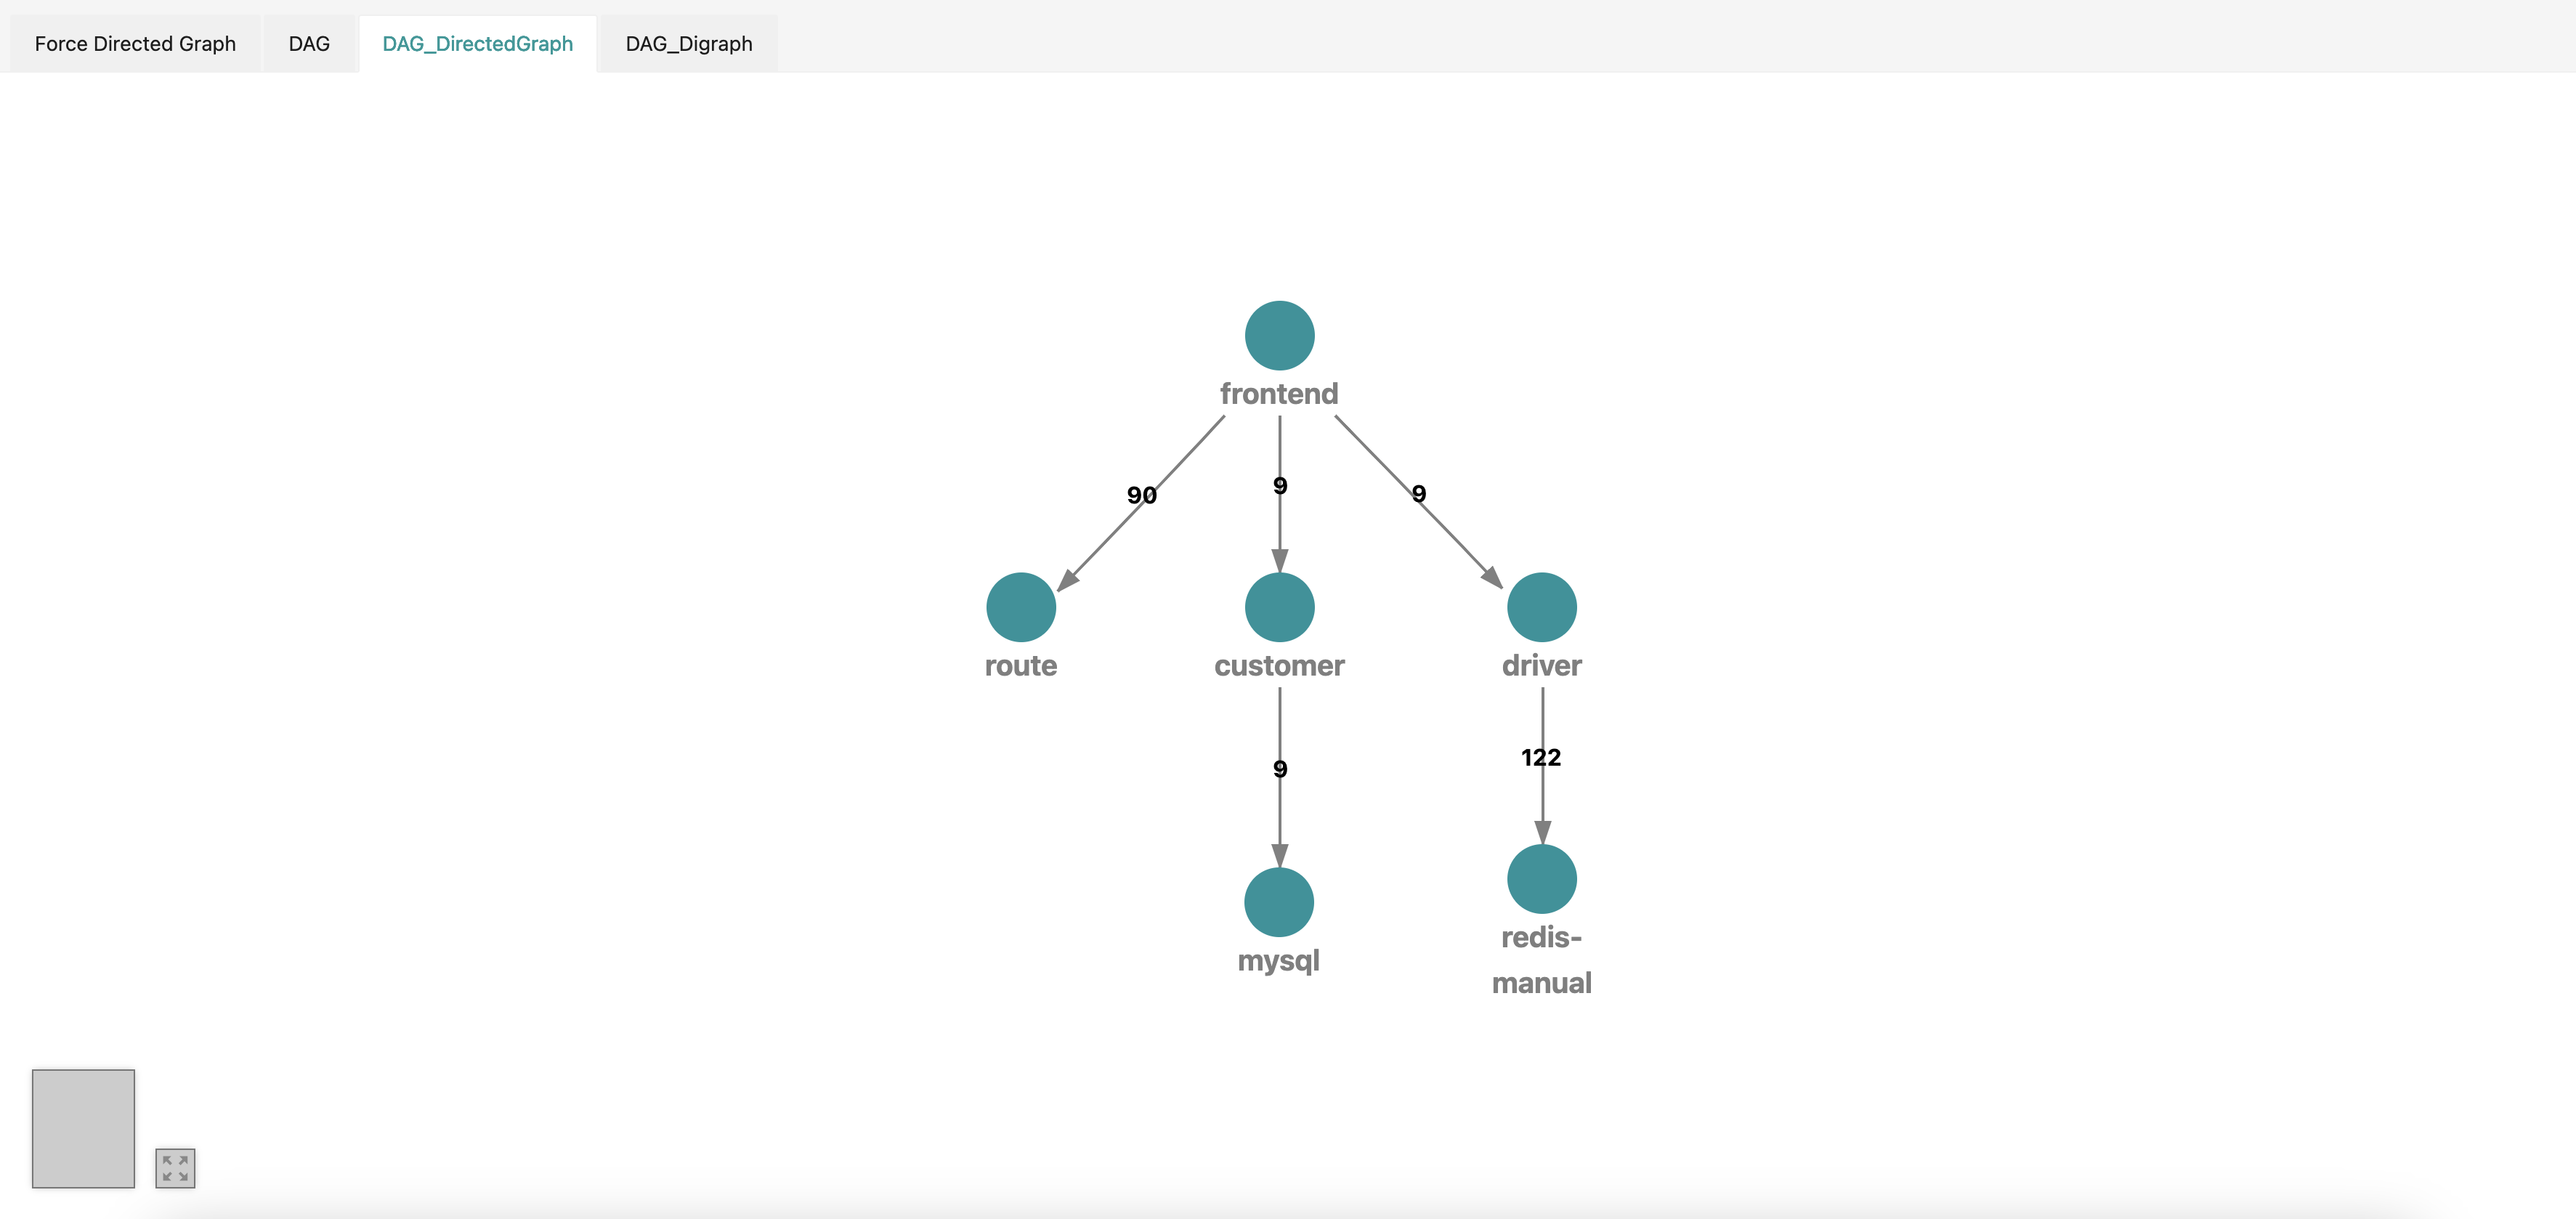
In the last week, we faced a blocker regarding displaying custom labels on the edges of the graphs, I managed to fix this by changing the Plexus internals and adding support for optional labels, this is how the result looked -
Yuri reviewed the changes and discovered that the DirectedGraph component is to be deprecated and needs to be removed from Plexus, which meant I could not use it for the migration task, the only option now was to try the Diagraph component.
Week 10
This week started with I and Yash rescheduling our weekly meeting twice and cancelling it the third time due to me falling sick
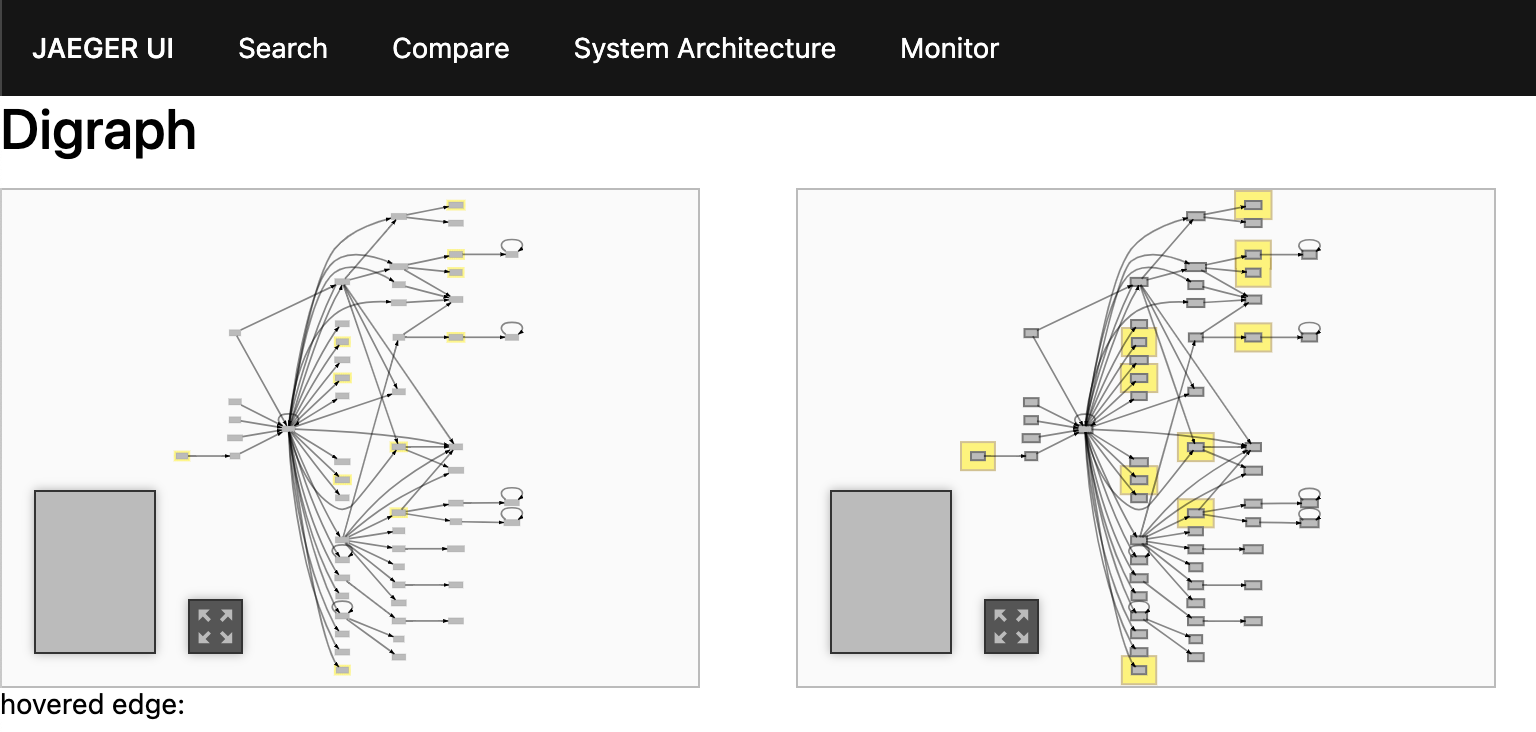
In the first half of the week, I tried using the Diagraph to render the graph but for some reason, the different layers of the graphs didn't render at all, to help with this Yuri suggested I try setting up the Plexus Demo and test things out
My friend Ansh Goyal, who too is working on the same project but a different task, helped me get the demo up and running and test things out.
The work for this week ended here with me suddenly getting a severe fever, which hampered my productivity but it's good that I managed to make some progress in the first half of the week.
Week 11
This week is currently in progress and I'll update the article at the end of the week.


