LFX Mentorship with CNCF Jaeger - Month Two Progress Report for Charts Migration Project

Mobile & Web Developer | Flutter | MERN | Next.js | T3 Stack
MLH Web3 Fellow'23 | LFX Mentee @ CNCF Jaeger'23 | Google Code-in 2019 | Open-source is <3
Web3 and Blockchain 🚀
It has been two months since I got accepted to contribute to CNCF's Jaeger's Chart Migration Project, here's the progress report for the second month
Introduction
This blog post is regarding my experience during the second month of this program, you can read the first month's blog here.
I'm assuming you're new here and don't have much idea regarding LFX and the Jaeger project, in case not, you can directly jump to the progress report.
What's LFX Mentorship?
LFX Mentorship is an open-source program designed to foster the growth of next-generation open-source developers. The program is run by the Linux Foundation, it pairs talented individuals with experienced mentors within various open-source projects like CNCF, Hyperledger, etc., enabling mentees to gain hands-on experience, contribute to impactful projects, and develop valuable skills
What's Jaeger?
Jaeger is an open-source distributed tracing application used to monitor and troubleshoot complex software based on microservices architecture.
Jaeger was originally developed at Uber but was later donated to the Cloud Native Computing Foundation (CNCF) for maintenance and further development.
Project Overview
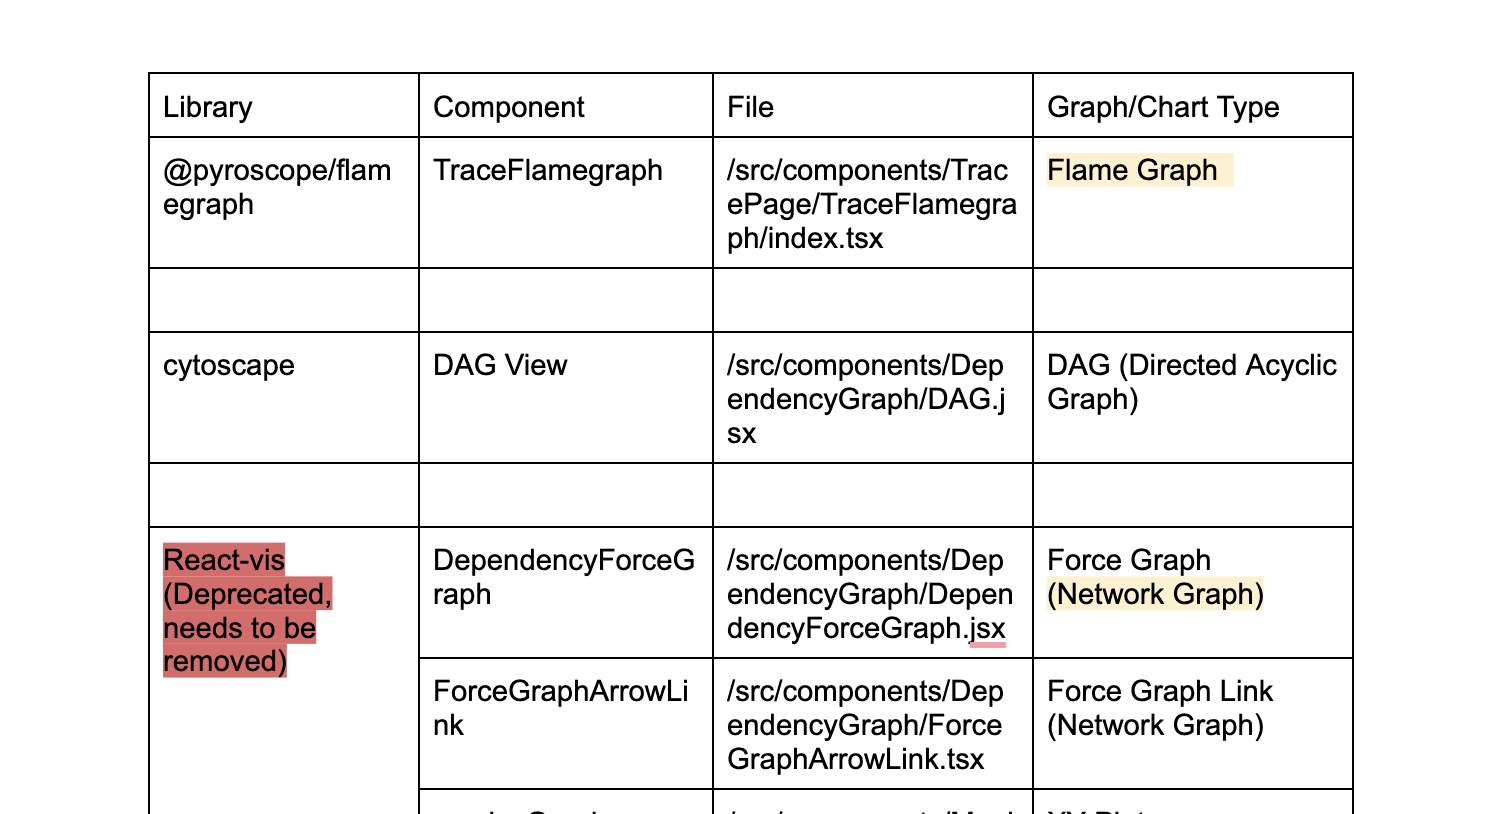
The Jaeger project has a lot of different graphs and visualization views, over the time different libraries were added to support different graph views, which led to having multiple graphing libraries as project dependencies, which is undesirable as it makes things like maintenance, debugging, refactoring, etc very difficult.
The goal of this project is to replace all libraries with a single library that can support all existing views, this will lead to more uniform and consistent designs along with reduced bundle size, faster performance, fewer configurations, and easy to maintain codebase.
More details about this project can be viewed here.
Project Progress
Let's continue from where we left off in the last blog.
Week 5
This week started with one of my pull requests getting merged and with this, the warm-up tasks were done and I became familiar with the project and how everything works, so it was time to start working on the problem I was selected for.
Mid-way into this week, I and Yash Sharma met to discuss the project strategy and he asked me to create a plan to migrate the graphs. Yash gave me the following tasks -
Find out all the affected files that need to be changed
Analyse the dept of required changes in case we need to use Plexus (an internal graphing library of Jaeger)
Verify if the existing implementation(s) can be migrated to Plexus
Check the same for any third-party libraries, in case we need to use one
Prioritise the
DAGview for now
Yash asked me to document all the things so that they can be tracked better for us to make good decisions regarding the direction of the project.
The rest of the week went into studying the codebase, libraries, etc to find the answer to the above questions.
Week 6
I created a document that answered all of the above questions by the start of this week, I again met Yash to discuss the document and he was happy about my case study and suggested I start migrating smaller components and incrementally move to larger components.
Just when I was about to start coding, Yuri Shkuro stepped in and made some drastic suggestions and indicated some more gaps needed to be fixed before we could start coding, his main concern was having a backup plan in case Plexus didn't support existing graphs.
Yuri suggested studying Cytoscape and Sigma.js libraries, I and Yash met again and I was tasked with some additional research.
Some other concerns that I needed to address -
Are the alternatives future-proof? I had to make sure the libraries were actively maintained, got good community support, used by other big projects, etc. In short, the library should be trustworthy.
Performance - can the graphs handle large data of up to 5k nodes?
Customisability - does it allow us to customise labels, edges, interactions, etc.
Is there support for stable/deterministic layouts? This was mandatory for graph views of a single trace, where nodes are arranged according to time and depth.
Size - how many dependencies does the new library have? Lesser the better.
These questions might look basic but the customizability thing came up in the last week and made things difficult for us. Overall, things became a lot clearer this week and we were almost set to start coding.
Week 7
Me and Yash met at the start of this week to discuss some doubts, after the meeting we talked to Yuri over Slack and finally came to some conclusions in the first half of the week itself.
We decided to go with the following plan -
Start with the
DAGview and migrate it to PlexusOnce done, move to System View migrations
And in case Plexus didn't support everything, consider Cytoscape/Sigma.js
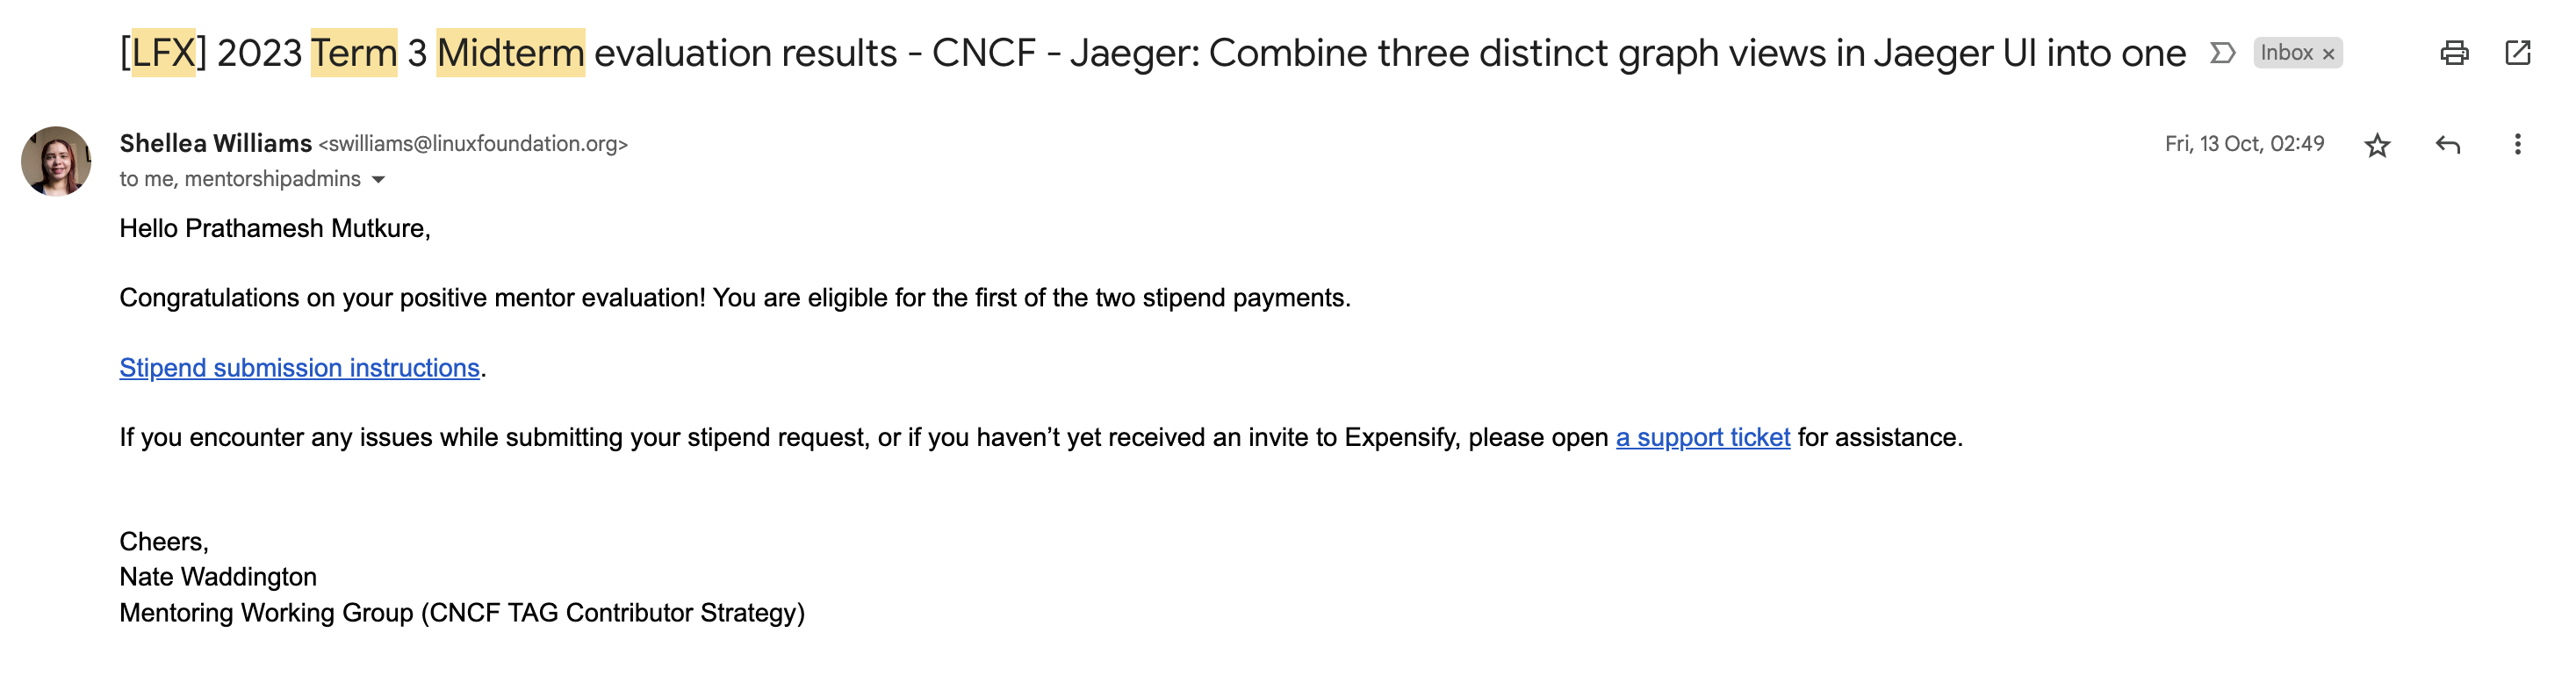
Yuri said completing the above tasks would make this project a success and around the same time, I passed the mid-term evaluation 🎉
In between all this, we came across another issue with the licensing of the pyroscope library which we used to display a flamegraph, as it got acquired by Grafana Labs, we could no longer use the newer version of it, thus opening doors to future vulnerabilities, we noted this down but decided to deprioritize this issue.
The strategy was finalized but I could not start coding as this week clashed with my mid-semester examinations and I asked my mentors if I could go slow to which they agreed :)
Week 8
In the final week of the month, I was finally free after the examinations and travelling back to my hometown from university for the Diwali holidays, and it was time to start coding and get my hands dirty.
I met Yash at the start of the week and he asked me to send changes by the end of the week, which I was successful in doing.
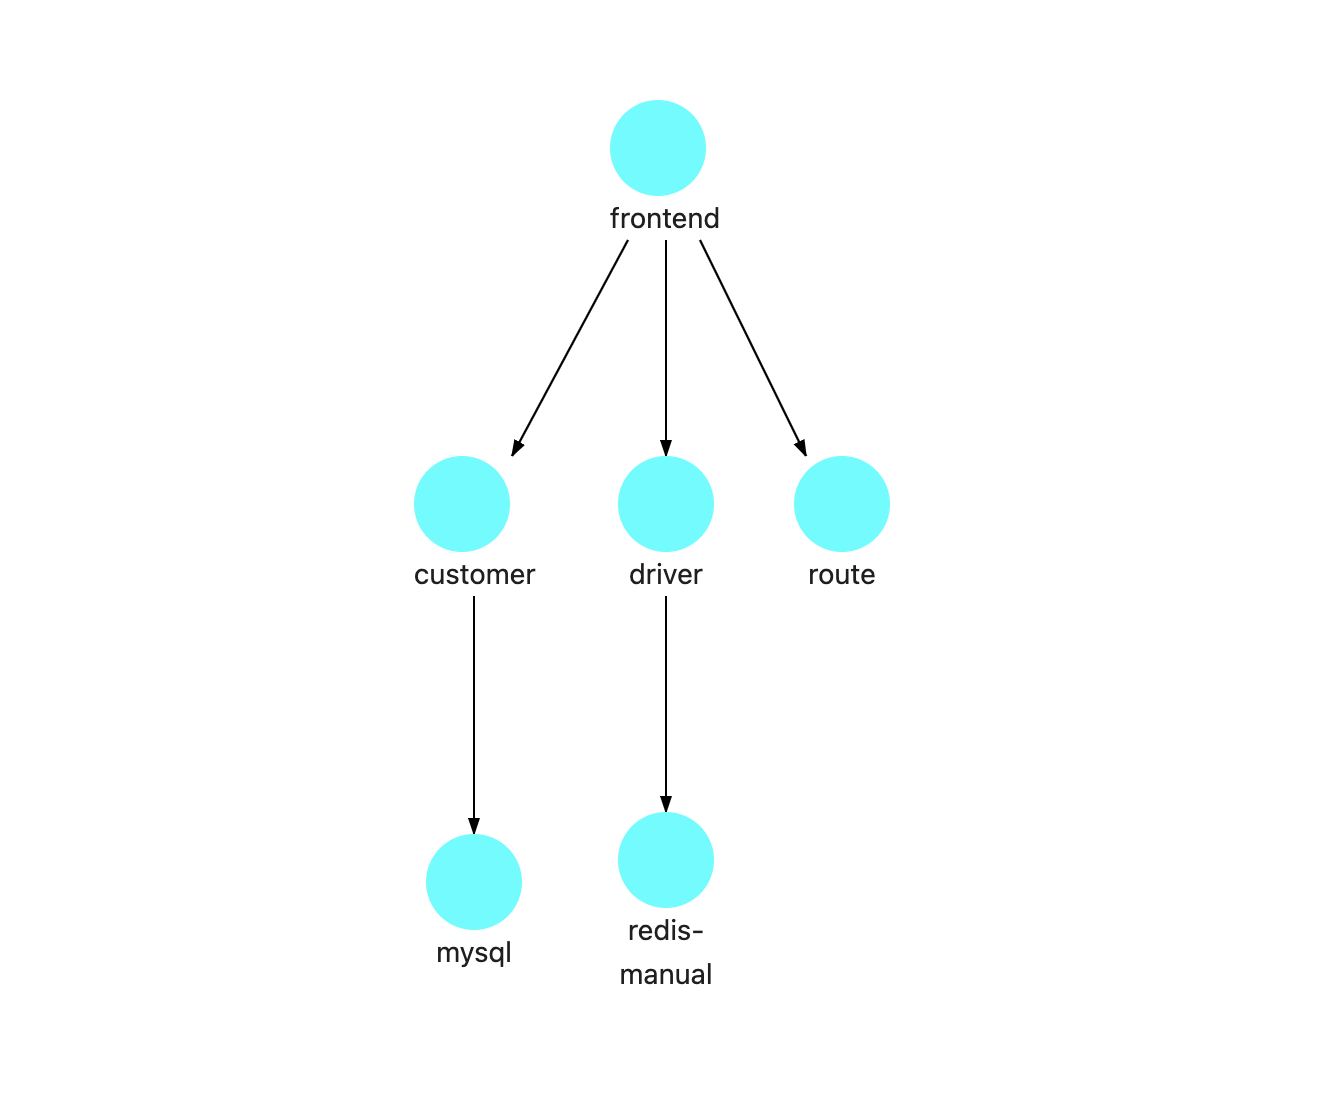
I first started migrating the DAG view to Plexus using its DirectedGraph component and achieved initial success as shown below but we encountered a problem, the DirectedGraph didn't allow me to override the edges thus I could not show the callCount of processes by covering the arrows as done in the existing implementation.
I talked to Yuri regarding the problem and he suggested I try the Diagraph component, as it is being used to render a similar tree in some other view, I tried doing it but the component being too complex with no documentation made things a lot harder than I thought.
Yuri and Yash suggested me to go through internal code, tests and examples to get an idea of the component and this is where the week ended with me having partial success in migrating the DAG view.
Conclusion
The second month of the program went very well and was overall productive, I was very happy that I was able to produce some results for the project but things are far from success and I need to step up the coding part as we are running out of time, I hope we could wrap things up by the first half of next month.
See you in the next blog,
Prathamesh Mutkure 🚀


